The monthly rainfall chart based on $50$ years of rainfall in Agra is shown in the following figure. Which of the following are true? ($k$ percentile is the value such that $k$ percent of the data fall below that value)
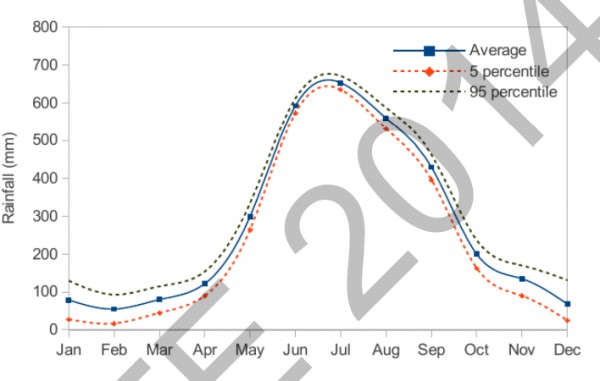
- On average, it rains more in July than in December
- Every year, the amount of rainfall in August is more than that in January
- July rainfall can be estimated with better confidence than February rainfall
- In August, there is at least $500$ mm of rainfall
- $\text{(i)}$ and $\text{(ii)}$
- $\text{(i)}$ and $\text{(iii)}$
- $\text{(ii)}$ and $\text{(iii)}$
- $\text{(iii)}$ and $\text{(iv)}$